Detecting and fixing high or abnormal memory usage in iOS and iPadOS apps.
High memory usage issue in iOS and iPadOS apps refers to a situation where an app consumes a significant amount of memory on a device. This can lead to slow performance, freezes, crashes, or even the termination of the app by the operating system.
When an app uses too much memory, it can cause the device to slow down, become unresponsive, or even crash. This issue can affect not only the app in question but also other apps running on the device, as well as the overall user experience.
Large images or media files: Loading large images, media files, or other resource-intensive assets can consume significant memory, causing the app to slow down, become unresponsive, or crash.
Inefficient memory management: Improper handling of memory allocation and deallocation can lead to excessive memory usage, negatively affecting the app's performance.
Too many background processes: Running numerous background processes, such as network calls, data processing, or location updates, can consume a considerable amount of memory, causing the device to slow down or become unresponsive.
Memory leaks: Unreleased memory allocations, often due to improper reference management, can accumulate over time, resulting in high memory usage and degraded app performance.
Complex UI components: Implementing complex user interface components or animations can consume a significant amount of memory, potentially causing slowdowns or crashes.
Data caching: Storing large amounts of data in cache for quick access can contribute to high memory usage, which can negatively impact the app's performance.
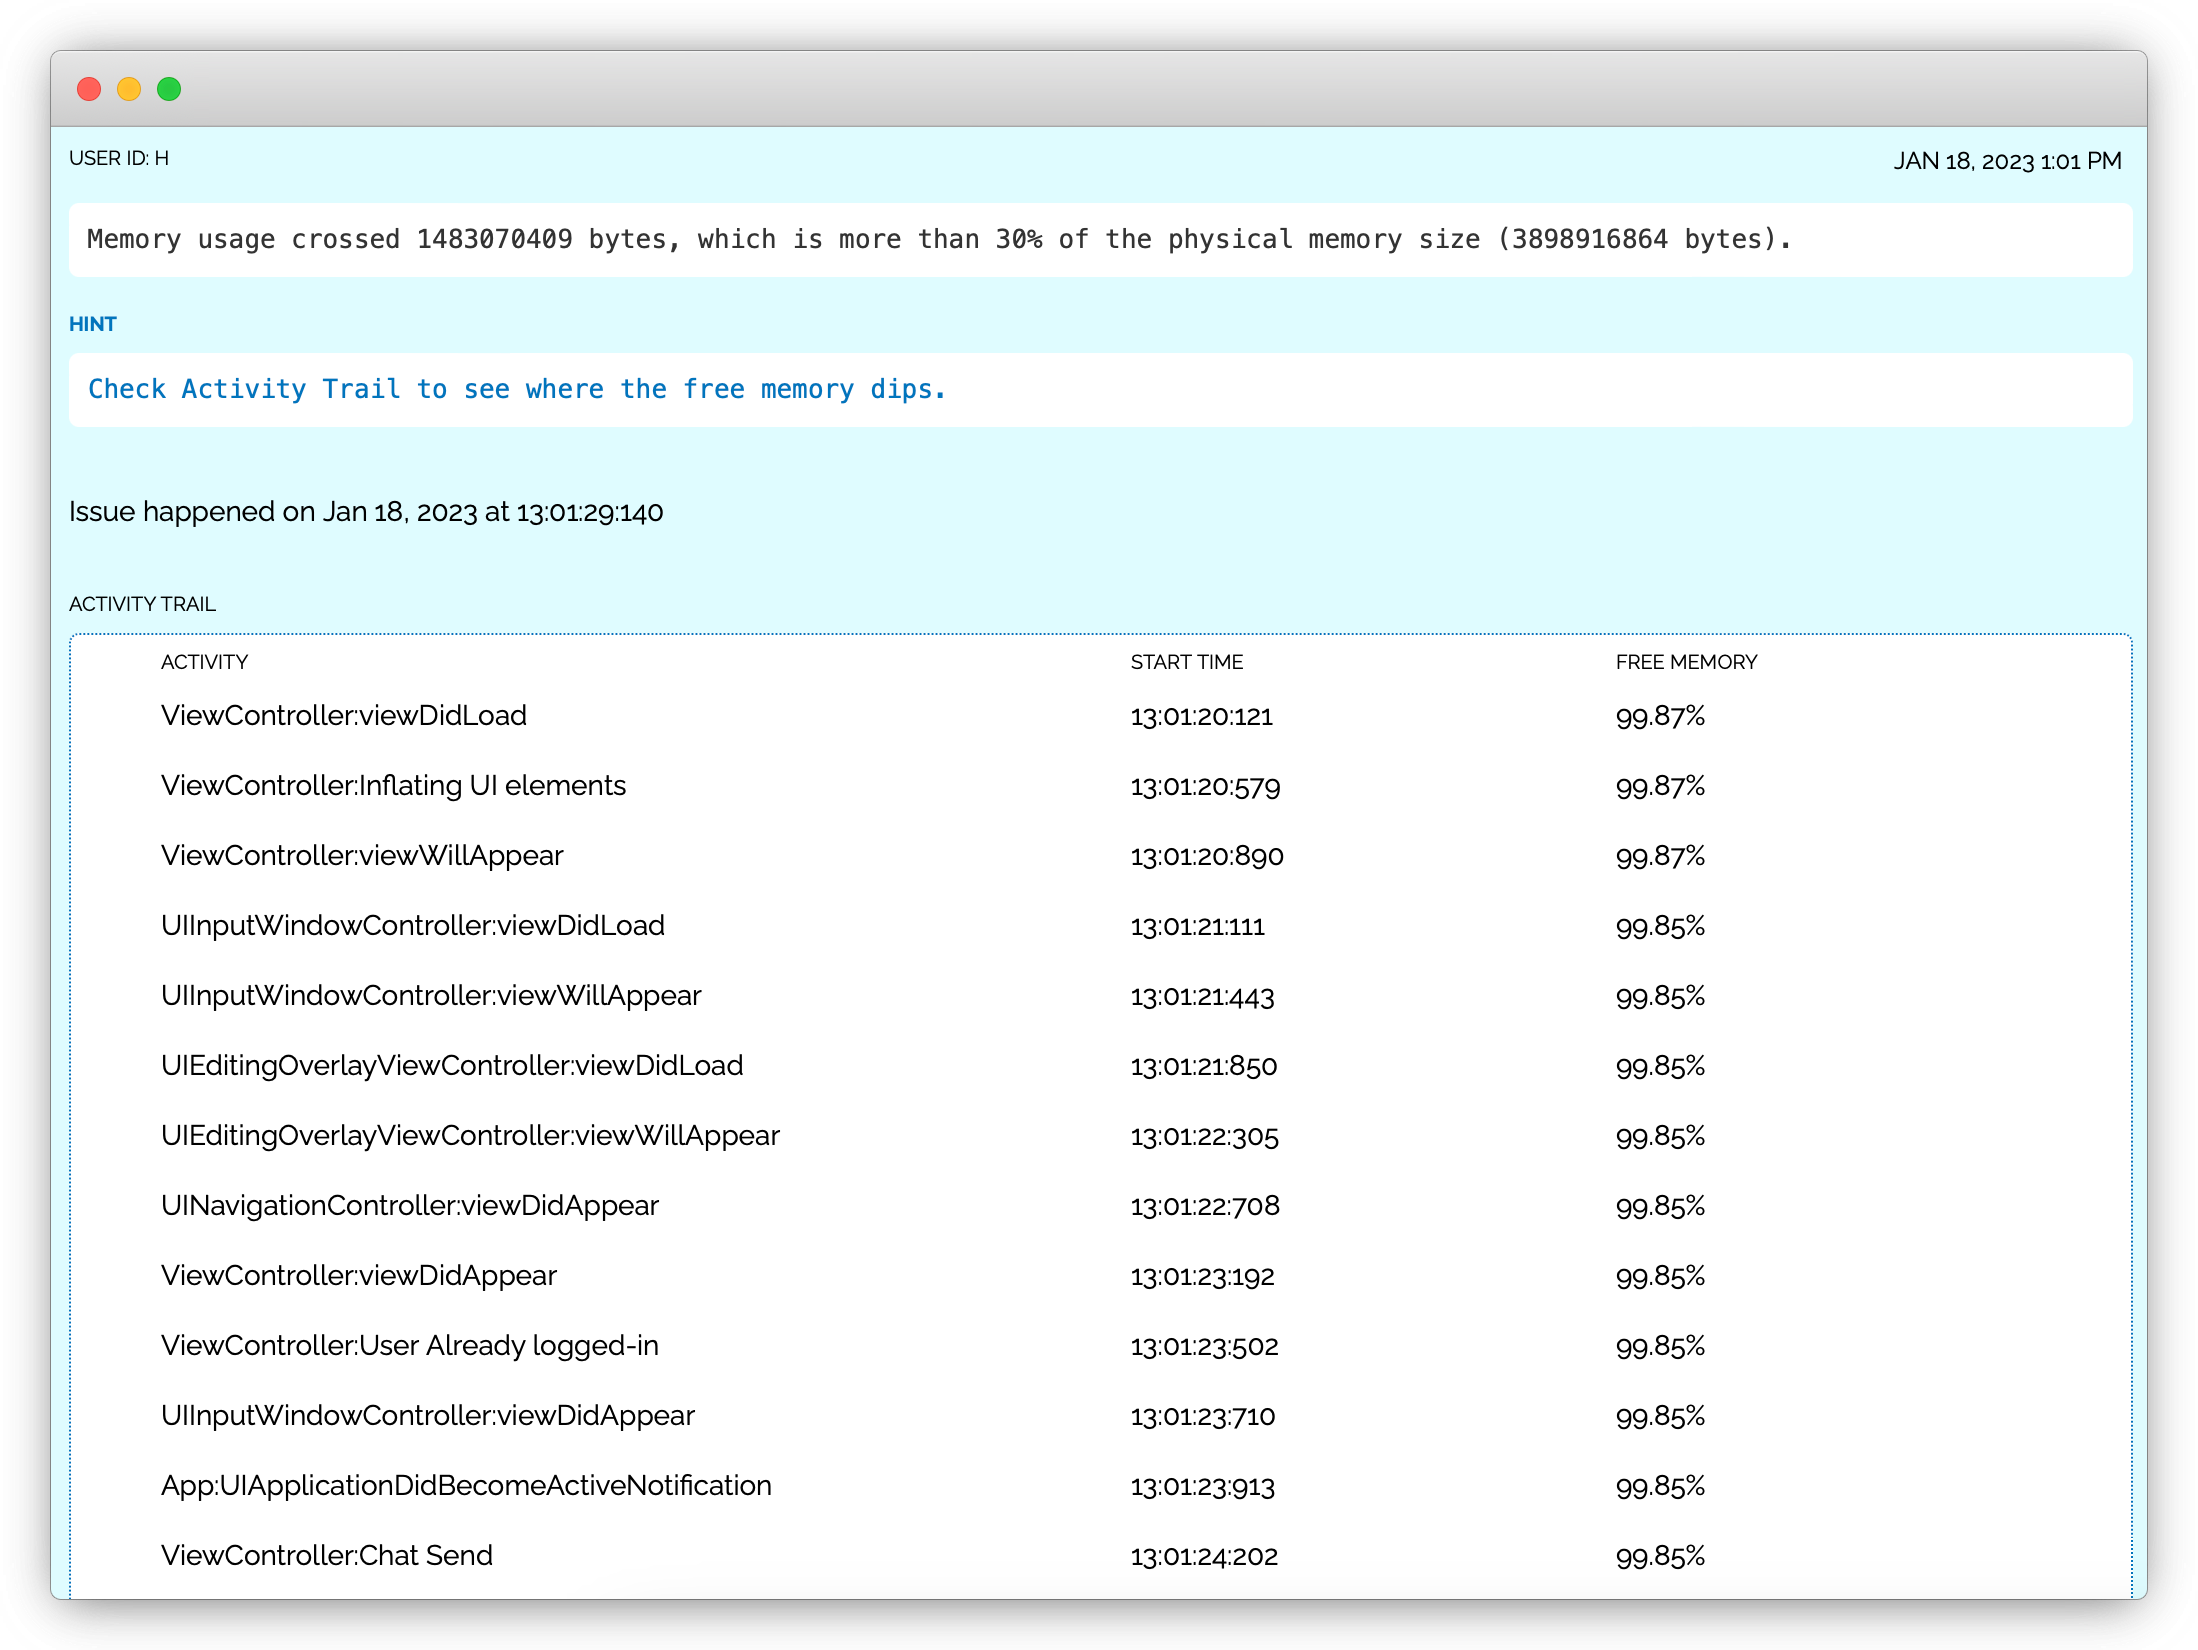
Issue reports provide the activity name along with the activity trail, which is a chronologically ordered list of events that occurred prior to the issue. The memory used by the app at each event is also included. This information helps developers isolate the area or activity causing the increase in memory usage.